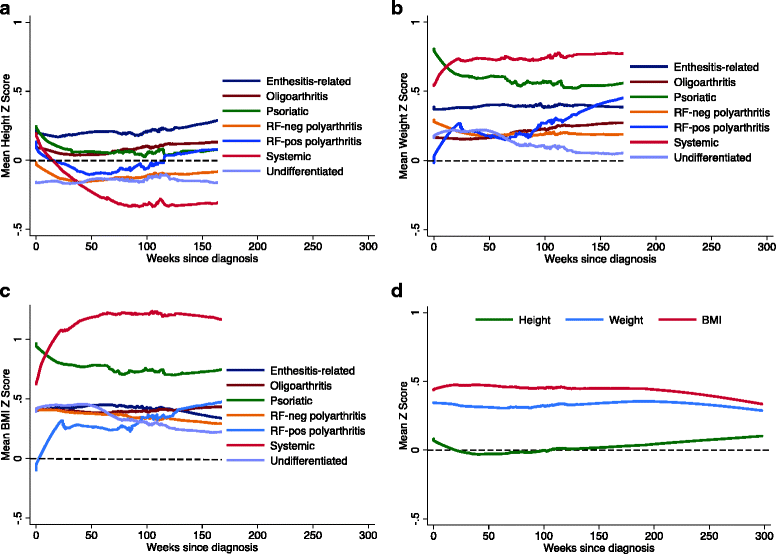
Fig. 2

Smoothed trajectories of mean Z-scores. Shown are trajectories of (a) height, (b) weight, and (c) BMI for each JIA category in the 3 years after diagnosis. Panel (d) shows Z-score trajectories for the whole cohort. Trajectories of the mean Z-score were charted using locally weighted scatter plot smoothing with a band width of 0.6. The black dashed horizontal line represents healthy growth standards
